
Histograms are overlooked by many people, often because they haven’t taken the time to figure out how to read them. The concept is fairly simple and the potential helpfulness is great. Learning how to read a histogram will help you make sure you nailed your exposure and give you confidence that when you go to edit it on a big screen, all the detail of your image is captured.
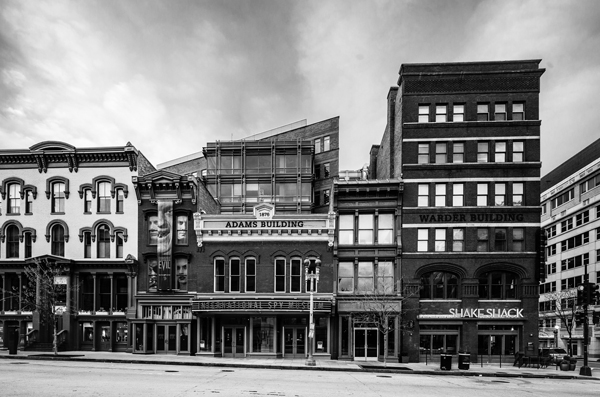
Downtown DCA pretty balanced histogram for the above photo.
What is a histogram?
A histogram is a record of the value of your pixels in the form of a bar graph. The frequency of pixels for each value of brightness is shown from left (darkest) to right (lightest). In a black and white image, there are 256 levels of gray, from black (0) to white (255). In a regular 8-bit RGB image there are 256 levels of brightness for each color: red, green and blue. The average brightness of each color used for each pixel gives you the value seen in a histogram—I’m only going to talk about black and white histograms for simplicity. The histogram allows you to see how many pixels of each shade there are relative to the others.
Why should I use it?
Most digital cameras have a 2-3 inch LCD screen. This is a great source of immediate feedback, but it does have limitations. What you are seeing is dependent on how bright your surroundings are—on a very bright day, the display may not be bright enough to really show you shadow and highlight areas. Even in a dark environment, zooming in on highlight and shadow areas may not show all the detail that is actually there. The histogram is a more accurate accounting of all the values of tone.
Histogram and exposure
Digital cameras are using digital information to gauge exposure. In the automatic modes, your camera is trying it’s best to give you a histogram that is weighted toward the middle, at a value that is halfway between black and white. This is why your camera’s automatic exposure looks a little dark when shooting toward the sun, or a little bit bright when shooting at night. The camera wants to retain detail in the midtones. Sometimes you don’t want too much detail in your midtones and your photos is supposed to be pretty dark or pretty light. The combination of using a manual exposure and keeping an eye on your histogram will help.
What does the graph represent?
In most situations you will want an evenly balanced histogram. Of course, there are many situations that call for something different. The midpoint of the histogram is the 128th level and sits in the middle of your histogram. Generally, you will want half the weight of the graph to be on the left and half to be on the right. The main thing to watch for is if the bulk of your pixels is leaning on one side of the histogram or the other, especially if they are stacked on against the far side of the graph. If the bulk of your pixels are one far side of the graph it means that you have lots of highlights or shadows and not much detail.
Examples of photos with histograms:
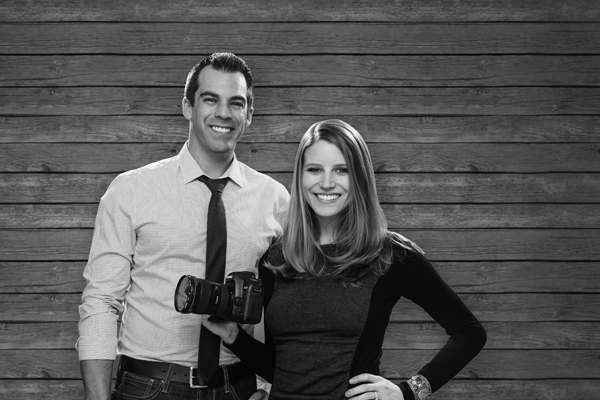
Erin and me in B&W.
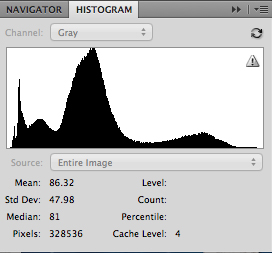
Histogram for Erin and me.
Notice how the Histogram leans to the left, since there are more dark areas than light areas in this photo.

Headshot on white.
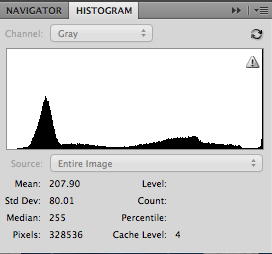
Histogram for headshot.
See the concentration of white pixels on the far right side of the image? It’s going through the roof! A balanced histogram is not always the right look.
Share tips, start a discussion or ask one of our experts or other students a question.
No Responses to “How to Read a Histogram to Nail Your Exposure”